This discussion is locked.
You cannot post a reply to this discussion. If you have a question start a new discussion

Can clouds improve PV output?

I've been playing with a slightly home-brew version of an open energy monitor, and been looking a some graphs of my minute-by-minute PV output and noticed something odd.


On a nice clear sunny day I get a nice bell-shaped curve for PV output peaking at solar midday (my panels face almost exactly due south) with a peak output a little below their peak rating. All as expected. When it's cloudy, output is of course much reduced, again as expected. What I've noticed is that when the sun returns after a cloud passes it seems that the PV output is for a short while higher than what would have been expected had there been continuous sunshine - not for long - a matter of minutes - before it returns to normal.


My guess is that this is due to the panels getting hot in the sun - which  drops their efficiency. When a cloud passes they get a chance to cool down for a but - so their efficiency goes up for a while until they've heated up again. Does that make sense?


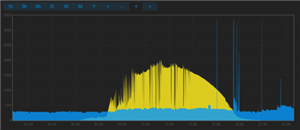
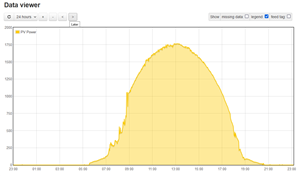
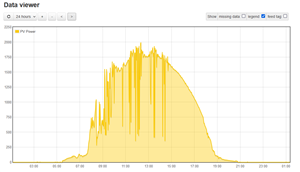
A couple of graphs (from a few days apart this month) (PV is yellow, ignore the blue, that's just my consumption).


Firstly from a pretty clear sunny day (just a few clouds first thing in the morning) - peak is well below the 2000W line.
f620f26d5e1fd3d8ff017864ce84e3f3-huge-pvsunny.png


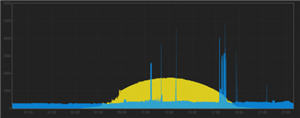
and then from a day with a few more broken clouds (unfortunately at a different scale - but after each cloud the output seems to be higher than the normal trend - at mid-day the spikes are much closer to the 2000W line than on a clear day) -
693782b11c6d89b9c59940095bf3bfdd-huge-pvsunnyish.png
  • Yes, clouds can increase PV output but only under certain relatively rare conditions.

    Consider a largely cloudy sky, but with a relatively small gap in the cloud cover that allows direct sunlight to fall on your array.

    The output power can exceed that produced under a clear sky. because the PV modules are exposed to direct sun AND also to the diffuse daylight from the clouds.


    In MOST conditions, PV modules are exposed to EITHER direct sun, or to diffuse daylight from white clouds, but under the conditions described above, they can be exposed to direct sun AND to diffuse daylight.


    In America, this fact is recognised by the NEC, which requires conductors connected to PV arrays to be sized in excess of that size suggested by the full load current. The phenomena is known as "solar lensing"


    If you have a light meter, this can be demonstrated as follows.

    Take a large piece of tracing paper and cut a hole in the middle.

    Support this exposed to direct sun, such that a large shadow is cast by the tracing paper, but with a bright spot of direct sun in the middle.

    Measure the light level in the bright spot, this will be the total of the direct sun through the hole and the diffuse light via the tracing paper. The reading will be greater than that from direct sun with the paper removed.
  • I'm not too sure what this is showing - there are 2 colours of blue blocks and a yellow arc - is one of these power output, and why is it solid, and not a line, does this represent the short duration blackouts.


    In any case it is certainly true that solar cells are more efficient in terms of photons to electrons, when they are cooler, as the rinsing temperature increases the vibrational scattering of the charge carriers, lowering the effective mobility of the electrons and holes. It is not really worth cooling cells in the UK, as the losses would be ~ a fraction of a % per degree, but in hotter places or very large area set-ups it can become worthwhile to add fans and air ducting to keep the back cooler.  In the UK leaving an air gap between panel and building is usually good enough

    Mike
  • I'm not too sure what this is showing - there are 2 colours of blue blocks and a yellow arc - is one of these power output, and why is it solid, and not a line, does this represent the short duration blackouts.

    Apologies - not my graphs - just what the OEM app produces by default.


    There are two lines on the same axes - PV generation and total consumption - both "filled" - so blue for consumption, yellow for PV and so producing cyan/light-blue where they overlap.


    So the total height of the yellow (or light blue/cyan) is the PV generation. The total height of the blue is my consumption - this the true blue area is "import" and the lighter blue/cyan area "internal consumption", so the pure yellow area "export".


    I'll see if I can produce some clearer ones...


       - Andy.
  • Perhaps these are clearer ... just PV output (hopefully for the same days):

    052bd5340a6a30af377935feeaa97ac2-original-simplesunny.pnge8c012b52c20fff3901fb8504ba41b62-original-simplesunnyish.png


       - Andy.
  • So, what appliances did you have running at 1.00 pm to make use of the electricity generated?
  • Thank you for the clarification, and yes, i can see what you mean about the overshoot on a restart vs  continuous, looks as if it could be as much as 10%.

    M.
  • (Just found this one again - I do wish they wouldn't move things out of the Wiring Regs!)

    So, what appliances did you have running at 1.00 pm to make use of the electricity generated?

    Often just my baseload of various controls, gadgets, fridge etc. (typically 200-300W), sometimes the washing machine, but on a good day the majority is exported and so used by the neighbours (I'm paid generously for generating it after all).


    and yes, i can see what you mean about the overshoot on a restart vs  continuous, looks as if it could be as much as 10%.

    Indeed. I was aware of the reduced efficiency with temperature but was surprised the effect was so large. The theory of just-out-of-line clouds redirecting a little extra light towards the panels makes a lot of sense too - so perhaps a combination of the two might explain the 10%(ish).

    Thinking about it, the thermal effect should always lag the cloud passage, but the cloud diffusion effect would presumably happen just as much with an approaching cloud as with a departing one - so a peak should sometimes appear before a trough in that case. I'll look closer at the data to see if I can see any such effect….

    Thanks all - it's been enlightening!

       - Andy.

  • Former Community Member
    0 Former Community Member

    Interesting Finds, can I ask what app you are using? And what sort of integration you have with your PV system ?


    Id like to monitor mine like this if possible

    Thanks - Jonny 


  • Former Community Member
    0 Former Community Member

    every cloud has a silver lining!  

  • Monitoring solar generation and import/export generally needs a “smart” inverter with an internet connection.  My Solax inverter sends reports to Solax every 10 minutes, so I can log on to the web site and see how it's doing, even if I'm not at home.


    I believe it's also possible to retro-fit monitoring systems to an existing solar install, using clip-on current clamps on both the incoming live meter tail and the live from the inverter.  I'm not sure if anybody still makes those.