This discussion is locked.
You cannot post a reply to this discussion. If you have a question start a new discussion

MCCB

I have several 800A Micrologic 2 MCCBs with only three adjustable settings Ir,tr and Isd. Ir is set at 0.7, tr is set at 4s at x6 Ir and Isd is set at 5. Is this not incompatible? My reckoning is that the Ir is 560A, tr holds an overload of 3360A for 4s but the short time pick up pulls the breaker out instantaneously at 2800A. All the devices are similarly set. There are no issues as a result but just wondering.
  • I can see where the confusion arises but there is a simple explanation (which I will probably make a mess of explaining and make it far more complicated so apologies in advance if the below doesn't help.....)

    The long time delay, often referred to as the overload setting or thermal trip curve, is an inverse time current curve such that the higher the current the shorter the operation time (and vice versa). As this is a defined curve with the inverse of the time approximately proportional to the square of the current. In order to set the whole of the curve it is therefore only necessary to define one point on the curve. The 4s at 6 x Ir therefore defines the whole of the curve from Ir upwards. The fact that the defined point is beyond the instantaneous trip point is irrelevant (though does present challenges in demonstrating correct operation since to demonstrate it does trip at 4s at 6 x Ir it will be necessary to switch off the instantaneous trip....)..

    Hope this helps,

    Alasdair
  • Yes but that was my point Alasdair,  if overload delay is the desire then the 4s delay setting is irrelevant as the instantaneous tripping current is much less.
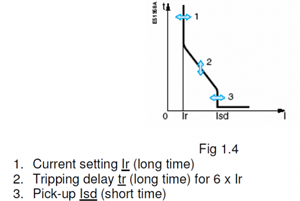
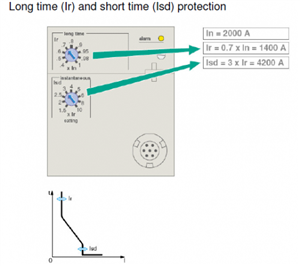
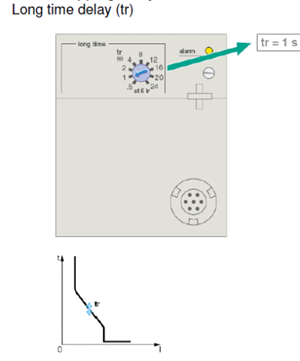
  • perhaps some pictures. nicked from the  set up guide for what I hope are the right sort of micro-logic devices

    2be2575c369e62ce96aec8b47eb3f5f8-huge-micro-logi2.png

    Now, in your case the region 2 gets cut off before the 6X value, so runs from Ir to about 5Ir. It is still useful and makes it behave rather more like an MCB curve B than  a C

    3c0cd44ece5d2ea4e6b60d56a3814c11-huge-micro-logi2set1.png


    3e62937b2ab3998fd061c609203ec240-huge-micro-logi2set2.png

    This is delay at 6 times, so at 5 times it will be 70 odd percent of that time

  • Thanks Mike,

    While you and I know what we mean, I am not sure your explanation is much clearer than mine, but the graphs certainly help.

    Lyle,

    Overload delay is always desired which is why it is an inverse time curve. The higher the overload the faster the trip time, since the circuit can withstand a 5% overload for far longer than a 50% overload while a 500% overload needs to be tripped much more rapidly.

    The whole point about the overload region is that it is a curve (or in the case of the log-log graphs that Mike has reproduced a straight line) and so there is a significant region (from Ir up to 5 x Ir) where the overload will trip the breaker without the instantaneous trip being activated. It is probably easier to think of it as the straight line on the log-log graph, as with a straight line of known gradient, in order to set the curve on the graph, you just need to define one point on it. The fact that this point is at six times Ir and therefore will never be utilised is irrelevant as the line from Ir to 5 x Ir has now been defined. This will enable you to determine the trip time for any defined overcurrent from the (now defined) tripping characteristics.

    Alasdair
  • OK, using the settings Lyle has, rather than the ones  in the pics lifted from the 'how to' guide.

    Let us consider higher and higher currents being taken


    At less than 0.7 of 800 A 560A , nothing trips and it stays on for ever. On the curves this is region 1 and all current to the left of it.

    At any higher current, the region 2 part of the curve applies, so there is a constant time *current product, with a slope equivalent to  4 seconds to reach 6In

    - so we know it should fire in 16 seconds at 1.5In (840A),  8 seconds at 3 In ( 560*3= 1680A), and intermediate points on that curve need a bit more thought to calculate. *

    Except, we never get right up to the 4 seconds point because when you exceed 5In, another bit of logic cuts in and it fires near instantly, region 3 so we never see anything slower than about 5 seconds, as any fault current above 2200A the fast action takes precedent.


    * the data sheet curves use log paper so y=1/x is a straight line.  Personally I like log paper, it makes my 'assume the horse is a sphere' sort of maths look almost reasonable.


    It is a fun if rather childish exercise for students to draw something, perhaps a picture of Mickey Mouse or Donald Duck, on a linear grid, and then replot the same points on log lin, or log log scales - it makes different bits of the date look more or less signifiant, and hammers home the importance of looking at the axes.

  • Ah! Thank you guys, the light is on!
  • errata I know you have it now, but in case anyone else is bothered at some point. Should have read.


    so we never see anything slower  a trip time lower than about 5 seconds on the region 2 curve, as for any fault current above 2200A (~ 5 seconds) the fast action takes precedent (region 3).


    Oops.


  • Mike,

    As you say, "oops". I didn't spot that mistake either.